Key aspects of trading chart analysis:
Identifying Trends:
Charts help visualize price movements over time, allowing traders to identify uptrends, downtrends, and sideways trends.
Recognizing Patterns:
Specific chart patterns, like head and shoulders, double tops/bottoms, and pennants, can signal potential trend reversals or continuations.
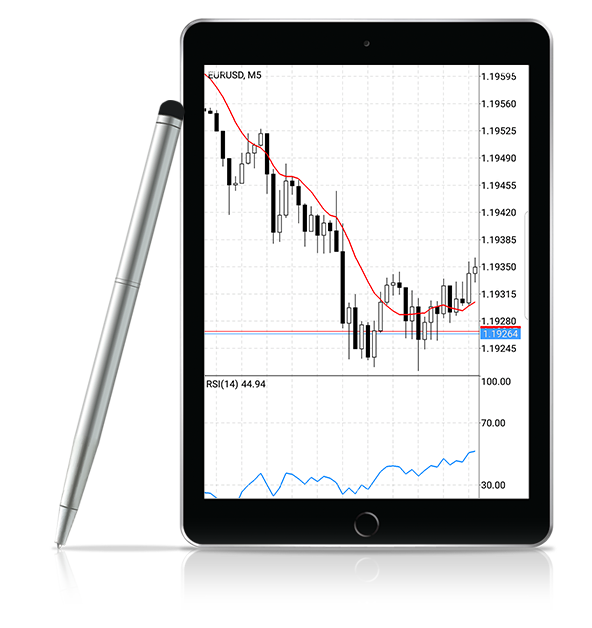
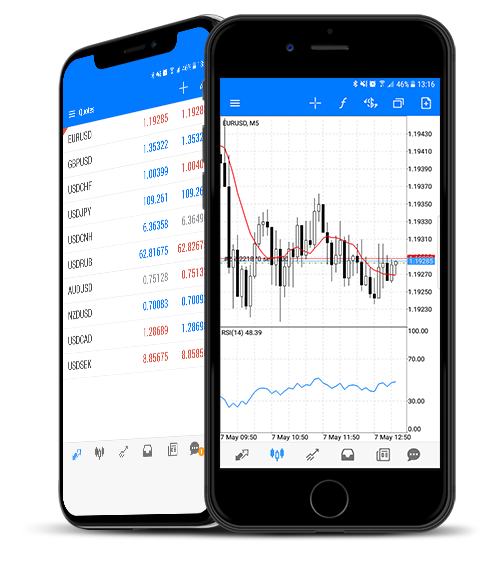
Using Indicators:
Various indicators, such as moving averages, RSI, and MACD, are used to analyze momentum, overbought/oversold conditions, and other market signals.
Understanding Support and Resistance:
Support and resistance levels represent price points where buyers and sellers are likely to enter or exit the market, influencing price movement.
Analyzing Volume:
Trading volume provides insights into the strength of price movements and can confirm or contradict price patterns.
Timeframes:
Different timeframes (e.g., 5-minute, daily, weekly) allow traders to analyze price action at different scales, helping them identify short-term and long-term trends.
Steps to interpret a trading chart:
1.Identify the chart type: Common chart types include line charts, bar charts, and candlestick charts.
2.Choose the timeframe: Select the appropriate timeframe based on your trading strategy and goals.
3.Observe the direction of price movement: Note whether the price is trending upwards, downwards, or sideways.
4.Check trading volume: Analyze the volume to confirm price trends and assess the strength of price movements.
5.Identify support and resistance levels: Determine potential areas of support and resistance on the chart.
6.Look for chart patterns: Identify recognizable patterns like head and shoulders or double tops/bottoms.
7.Use technical indicators: Apply relevant indicators to gain further insights into market conditions.